technical · Article
Inside the CBTC Braking Curve: How Safe Stopping Distance Is Calculated

A Communications-Based Train Control (CBTC) train running at 80 km/h on level track with worst-case wet-rail adhesion needs roughly 250 meters to stop kinematically — a number any first-year mechanical engineering student can derive from v² = u² + 2as. The same train, on a 3 percent downgrade with realistic position uncertainty and finite system reaction time, needs about 320 meters as the contractual safe stopping distance the onboard Automatic Train Protection (ATP) actually enforces. The gap between the textbook 250 and the operational 320 is where CBTC engineering lives. This article is an engineer-to-engineer walkthrough of how the Emergency Braking Curve and Service Braking Curve are computed, what each parameter contributes to the final safe stopping distance, and why a 10 percent improvement in any single parameter translates almost linearly into headway capacity.
Why the braking curve is the architectural metronome
The braking curve is not one curve. It is a four-tier speed envelope that the onboard ATP recomputes every 50 to 100 milliseconds and enforces against actual measured speed. The four tiers are the Permitted Speed (the maximum speed the system allows, equal to the lower of all applicable static and dynamic limits), the Warning Curve (an audible and visual alert to the driver, typically 3 to 5 seconds before the train would touch the next tier), the Service Braking Distance (SBD, where the ATP applies service brake automatically at typically 0.8 to 1.0 m/s²), and the Emergency Braking Distance (EBD, the absolute safety limit at typically 1.0 to 1.3 m/s², where ATP triggers emergency brake regardless of operator input). At any given distance ahead of the train, EBD < SBD < Warning Curve < Permitted Speed by construction. This article is for the signaling engineer, ATP architect, system integrator, and Independent Safety Assessor who need to understand how each parameter feeds the envelope. The full treatment lives in Chapter 4 of Communications-Based Train Control, Volume 1.
The kinematic baseline: v² = u² + 2as
The starting point is the elementary kinematic equation. For a train decelerating uniformly from initial velocity u to final velocity v over distance s with constant acceleration a:
v² = u² + 2as
For a stop (v = 0), and treating deceleration as the magnitude of negative acceleration:
s = u² / (2a)
A train at 80 km/h is moving at 22.2 m/s. Decelerating at 1.0 m/s², it travels:
s = (22.2)² / (2 × 1.0) = 246 m
This is the kinematic stopping distance on level, dry track with no system delays and no position uncertainty. It is the distance every other parameter compounds against. A 1.2 m/s² deceleration rate cuts the kinematic distance to 205 meters; a 0.8 m/s² rate extends it to 308 meters. The deceleration parameter alone can swing safe stopping distance by 50 percent, which is why brake performance certification is one of the most-audited sections of any CBTC safety case.
Gradient: how 4 percent down adds 64 percent
Gradient modifies the effective deceleration. On a downgrade, gravity opposes braking, reducing the net deceleration the train can achieve:
a_net = a_brake − g × sin(θ)
where g = 9.81 m/s² and θ is the grade angle. For a 4 percent downgrade, θ ≈ 2.3°, sin(θ) ≈ 0.04, and the gravity contribution is 9.81 × 0.04 ≈ 0.39 m/s². The net deceleration on a 4 percent downgrade with a 1.0 m/s² brake rate is:
a_net = 1.0 − 0.39 = 0.61 m/s²
Substituting into the kinematic equation, the stopping distance grows from 246 meters on level track to:
s = (22.2)² / (2 × 0.61) = 404 m
A 64 percent penalty for a 4 percent downgrade. Upgrades work the opposite way — gravity assists braking, shortening stopping distance. The ATP must apply gradient compensation continuously based on the track database (covered in How CBTC Trains Know Where They Are (Without Track Circuits)) and the train’s current position; no static stopping-distance table is sufficient.
Adhesion: the wheel-rail friction ceiling
Brake force is limited by the wheel-rail friction coefficient μ. If the required deceleration exceeds μ × g, the wheels slip and braking degrades. Modern brake systems with wheel-slip protection target μ ≈ 0.25 to 0.35 in worst-case wet, contaminated conditions. The adhesion-limited deceleration is:
a_adhesion = μ × g
At μ = 0.25, the adhesion ceiling is 0.25 × 9.81 ≈ 2.5 m/s² — well above the 1.0 to 1.3 m/s² emergency brake rate, so adhesion is not normally the binding constraint on level dry track. At μ = 0.10 (snow, leaves, or contaminated track), the ceiling drops to 0.98 m/s², which is below the typical emergency brake rate. In those conditions, adhesion governs, not the brake hardware. CBTC ATP implementations typically include a worst-case adhesion assumption baked into the EBD calculation, with operational overrides where adhesion sensing or environmental data justify a less conservative assumption.
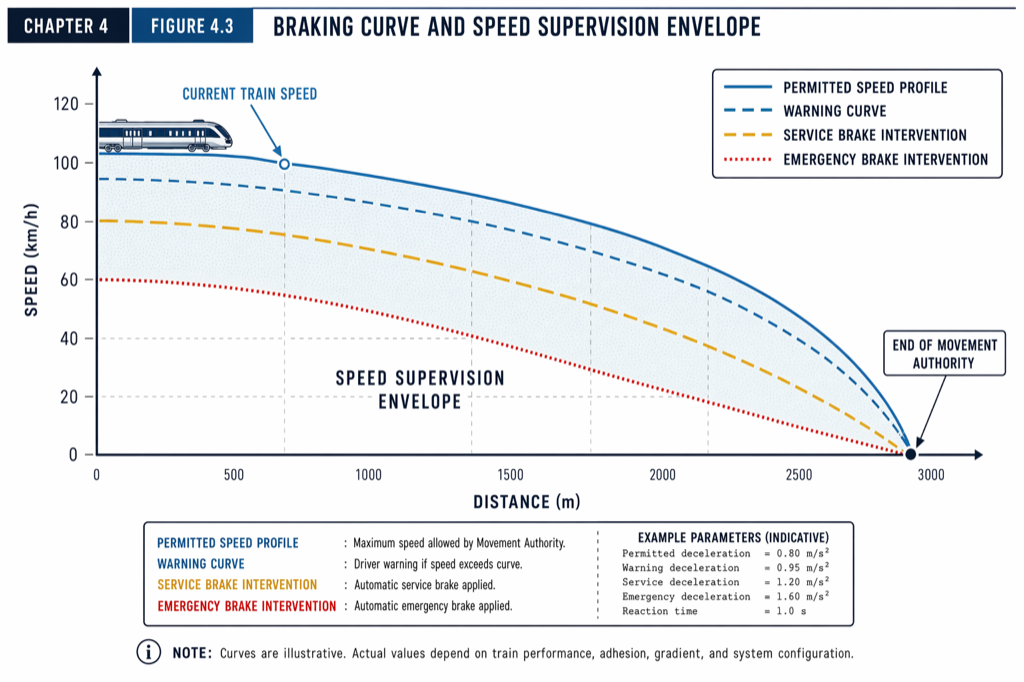 The four-tier speed envelope: at every distance ahead, EBD < SBD < Warning Curve < Permitted Speed. ATP enforces the envelope by recomputing it every 50 to 100 ms.
The non-kinematic budget: reaction time and uncertainty
Kinematic distance is the floor. The operational safe stopping distance is the kinematic distance plus four non-kinematic budgets the ATP must reserve.
Position uncertainty. The train’s true position is known only to within the localization uncertainty band — typically ±10 to 20 meters on well-equipped CBTC lines. The ATP computes EBD as if the train is already at the optimistic end of that band: 10 to 20 meters farther along than the best-estimate position suggests.
Communication latency. The Movement Authority (MA) takes time to propagate from the wayside Zone Controller to the onboard Vehicle On-Board Controller (VOBC). The radio uplink, processing, and downlink budget is typically 100 to 300 ms. During that window, the train continues at its current speed under the previously received MA, distance equal to v × t_comm.
Processing delay. The onboard ATP takes time to detect overspeed, compute the relevant braking curve, validate against redundant channels, and issue the brake command — typically 200 to 500 ms.
Brake response time. The mechanical lag from brake command to full pressure buildup in pneumatic or hydraulic brake systems is 0.5 to 1.0 second for passenger trains. During this lag, the train continues at its pre-brake velocity, distance equal to v × t_brake.
The total system reaction time t_reaction is the sum of communication, processing, and brake response — typically 1.0 to 2.0 seconds. At 80 km/h:
s_reaction = v × t_reaction = 22.2 m/s × 1.5 s = 33 m
This 33 meters is added to the kinematic stopping distance and to the position uncertainty margin to produce the EBD.
Putting it together: a worked safe stopping distance
Take the worked example from manuscript Chapter 4.3: an 80 km/h train on a 3 percent downgrade with ±15 m position uncertainty, worst-case μ = 0.25 adhesion, and 1.5 s system reaction time.
| Component | Distance (m) |
|---|---|
| Reaction time (22.2 m/s × 1.5 s) | 33 |
| Kinematic braking, gradient and adhesion adjusted | 245 |
| Position uncertainty margin | 15 |
| Brake response and processing margin | 25 |
| Total Safe Stopping Distance (EBD) | 318 |
The kinematic component alone would suggest 246 m. The full EBD is 318 m — about 30 percent longer than the textbook number. On a 4 percent downgrade with μ = 0.20 (a winter rail-leaf scenario in the Northeast), the same calculation produces an EBD comfortably above 400 meters at 80 km/h. The numerical sensitivity is why the Chicago ‘L’ Red Line modernization in manuscript Chapter 4.3 specifies position accuracy ±12 m, emergency brake rate 1.2 m/s², and 1.2-second reaction time — the aggressive parameter set that yields a 320 m EBD at 80 km/h, exactly what 90-second headways require on the existing guideway.
End of Authority versus Supervised Location
The MA defines an End of Authority (EoA) — the exact position to which the train is authorized to proceed. Beyond the EoA, movement is prohibited. To account for position uncertainty, modern CBTC systems also define a Supervised Location (SvL) that is offset from the EoA by the worst-case position error.
If the EoA is at km 10.500 and position uncertainty is ±15 meters, the SvL is at km 10.485. The ATP computes braking curves to the SvL, treating the train as if it were 15 meters farther along than its best-estimate position. This guarantees that even in worst-case position error, the train physically stops at or before the true EoA. The 15 meters is invisible to the operator but is the difference between a CBTC system that survives an audit and one that does not. (For how the EoA is generated and updated upstream, see The Movement Authority Concept: How a CBTC Train Decides How Far to Go.)
Why braking curves drive headway
The braking curve is not just a safety mechanism. It is the binding constraint on achievable headway. For a busy urban heavy-rail line operating at 90-second headways, the safe stopping distance at maximum speed occupies 35 to 45 percent of the headway interval. The remaining headway absorbs station dwell, position-report and MA-update cycles, and operational margin.
A 10 percent improvement in EBD translates almost linearly into a 10 percent reduction in safety headway. Conversely, conservative parameter choices — ±30 m position uncertainty instead of ±15 m, 0.8 m/s² emergency brake rate instead of 1.2, 2.0 s reaction time instead of 1.0 — increase EBD by 30 to 40 percent and force commensurately wider headways. This is the parameter trade the safety case has to defend: aggressive parameters require high-grade equipment, rigorous brake testing, and meticulous odometry maintenance, while conservative parameters are easier to certify but cap line capacity.
The Chicago ‘L’ Red Line modernization referenced in manuscript Chapter 4.3 chose aggressive: ±12 m position uncertainty, 1.2 m/s² emergency brake rate, 1.2 s reaction time, EBD ≈ 320 m at 80 km/h, 90-second headways. The Massachusetts Bay Transportation Authority (MBTA) Blue Line Phase II expansion in the same chapter chose conservative: ±18 m position uncertainty, 1.0 m/s² emergency brake rate, 1.5 s reaction time, wider safety margins, 120 to 135 second headways. Both approaches are defensible. The choice is a system design judgment about what the corridor actually needs.
The ATP cycle: how the curve is enforced
The onboard ATP does not compute the EBD once. It executes a continuous supervision cycle every 50 to 100 milliseconds (covered in detail in The Heartbeat Cycle: 200 ms That Keep Modern Metros Safe). Each cycle reads current position and speed from odometry and the VOBC, retrieves the latest MA from the wayside (or uses the cached MA if no update was received), computes the permitted speed and the four-tier envelope based on EoA, static restrictions, train performance, and worst-case safety assumptions, checks current speed against each curve, and applies control outputs:
- If speed ≤ Permitted Speed: continue at current speed or accelerate toward ATO target.
- If Warning Curve touched: sound alarm and alert driver.
- If SBD touched: apply service brake automatically at the certified service rate.
- If EBD touched: apply emergency brake at the certified emergency rate, no further negotiation.
The 50 to 100 ms cycle ensures that the system responds to overspeed within 50 to 200 ms — far faster than any human driver. The cycle time is hardware-bounded by the onboard real-time operating system kernel (INTEGRITY, QNX Neutrino, or VxWorks are common in vital railway applications); cycle overruns trigger watchdog reset and safe-state transition.
 Every 50 to 100 ms, the ATP recomputes the envelope and enforces it. Cycle overruns trigger safe-state transition through the hardware watchdog.
Practical takeaways
- The kinematic stopping distance v²/(2a) is the floor, not the answer. Operational EBD adds gradient and adhesion adjustments, position uncertainty, communication and processing delay, and brake response lag. The realistic EBD is typically 25 to 35 percent above the kinematic baseline.
- Brake deceleration rate is the single largest lever on stopping distance. A 1.2 m/s² rate produces about 25 percent shorter EBD than a 1.0 m/s² rate at the same speed; the trade-off is brake hardware grade, certification rigor, and ongoing performance verification.
- Position uncertainty translates directly into Supervised Location offset, which translates into added EBD. ±10 m versus ±20 m uncertainty matters as much for headway as the brake rate does.
- The four-tier envelope (Permitted Speed, Warning Curve, SBD, EBD) gives the train and the operator multiple opportunities to slow before the safety limit. Defense in depth is the architectural pattern; emergency brake is the last resort, not the first.
- Aggressive braking curve parameters require high-grade equipment and rigorous maintenance. Conservative parameters are easier to certify but cap line capacity. The choice is a deliberate system design judgment, not an operational default.
Where to go next
This post is an 11-minute engineer’s primer. The full speed-supervision and braking-curve treatment lives in Chapter 4 (Onboard Equipment), section 4.3, of Communications-Based Train Control, Volume 1: Foundations & Technical Architecture (Buy on Amazon). Download Chapter 4 slides (free PDF) for the speed envelope and ATP cycle diagrams.
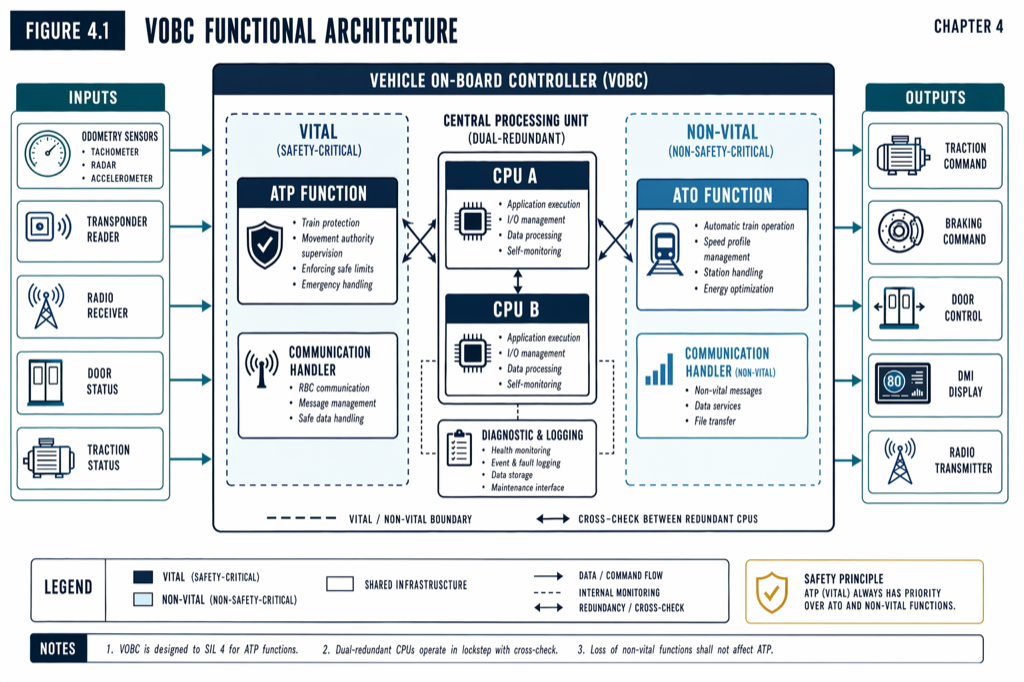
For the onboard hardware that runs the cycle, see The Onboard Side of CBTC: Inside the VOBC. For how the Movement Authority that bounds the EBD is generated upstream, see The Movement Authority Concept: How a CBTC Train Decides How Far to Go.
Sources
- Wang, C. (2026). Communications-Based Train Control, Volume 1: Foundations & Technical Architecture. Independent. ISBN 979-8-258-54295-3. — Chapter 4, “Onboard Equipment,” section 4.3.
- IEEE Standards Association. IEEE Std 1474.1: Communications-Based Train Control (CBTC) Performance and Functional Requirements.
- International Electrotechnical Commission. IEC 61508: Functional Safety of Electrical/Electronic/Programmable Electronic Safety-related Systems.
- CENELEC. EN 50129: Railway applications — Safety related electronic systems for signalling.
- Federal Transit Administration. Circular 4220.1: Third Party Contracting Guidance. transit.dot.gov
- MTA New York City Transit. Communications-Based Train Control Status Update. new.mta.info/project/communications-based-train-control-cbtc
- Massachusetts Bay Transportation Authority. Blue Line Modernization. mbta.com/projects
- Chicago Transit Authority. Red and Purple Modernization. transitchicago.com
Read the full treatment in the book
Chapter 4 of Communications-Based Train Control, Volume 1, covers this in depth.