procurement · Article
CBTC Lifecycle Cost: A 30-Year Model Walk-Through

The Federal Transit Administration’s Benefit-Cost Analysis (BCA) framework requires Communications-Based Train Control (CBTC) project applications to discount all future costs and benefits to present value over a 25 to 30 year horizon. Office of Management and Budget (OMB) Circular A-94 prescribes a 2.0 percent real discount rate for analyses spanning 10 to 30 years. Every major Capital Investment Grant (CIG) application — Chicago’s Red and Purple Lines modernization at $2.1 billion, BART’s Train Control Modernization Program, the MTA’s L Line and Queens Boulevard projects, the proposed Honolulu HART extensions — has assembled some version of the same discounted cash-flow analysis, and every board approval and rating-agency review has scrutinized it. This post walks through a representative 30-year lifecycle cost model for a 25-mile US brownfield CBTC project, identifies the four lifecycle phases that drive the cost shape, and explains the sensitivity bands that distinguish a defensible analysis from one that the FTA Project Management Oversight Contractor will return for revision.
Why the 30-year model matters
A CBTC procurement is a capital decision with a 30-year operating tail. The initial CAPEX that closes the procurement is roughly 35 to 50 percent of the undiscounted lifecycle cost — the rest is operating expenditure, software support, technology refresh cycles, and end-of-life planning. Financial analysis that scopes only the CAPEX commits the agency to a 30-year financial trajectory it has not modeled. This post is for the chief financial officer, the FTA grants officer, the rating agency analyst, and the program manager building the financial plan that the board approves and the FTA evaluates. The depth lives in Chapter 14 of Communications-Based Train Control, Volume 2; this is the worked example.
The three frameworks
Three related cost frameworks surface in CBTC financial analysis. Total Cost of Ownership (TCO) is the nominal, undiscounted aggregation of all costs across the lifecycle. Lifecycle Cost Analysis (LCCA) discounts those nominal costs to present value at a specified rate, typically OMB’s 2.0 percent real for a 30-year horizon. Net Present Value (NPV) extends LCCA to incorporate financing assumptions, including TIFIA loan terms or Public-Private Partnership debt-equity structures. For FTA Capital Investment Grant evaluation, LCCA at the OMB rate is the principal decision metric. For Public-Private Partnership negotiations, the relevant rate is the project’s Weighted Average Cost of Capital (WACC), typically 5 to 8 percent real, which compresses future costs more aggressively. Discount rate selection alone moves the headline TCO figure by 5 to 10 percent across realistic ranges.
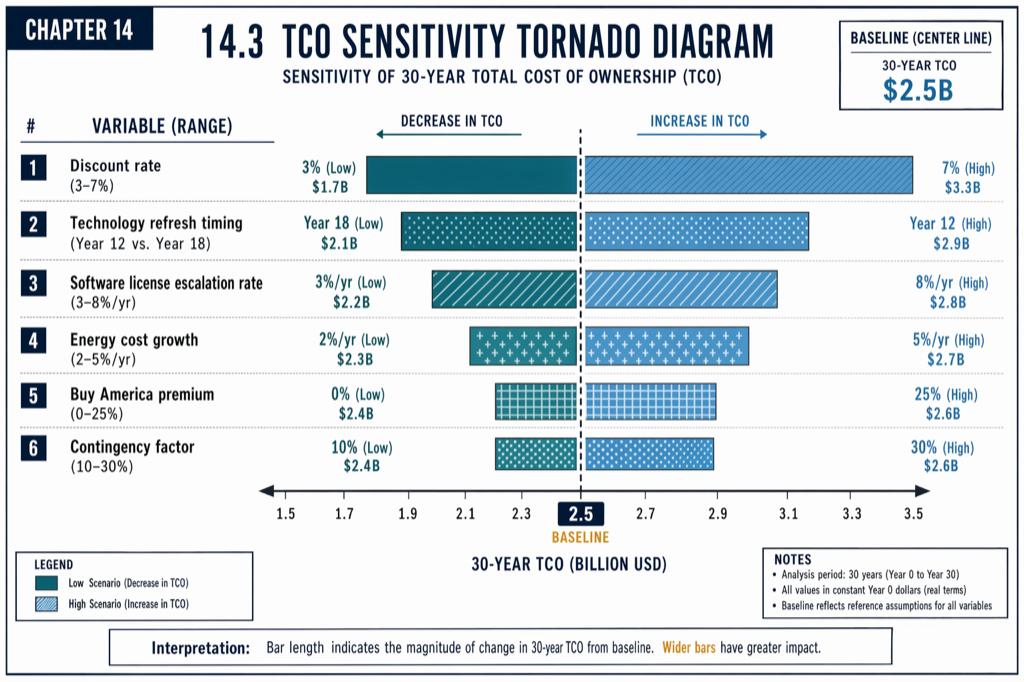 Discount rate selection moves the headline lifecycle cost figure by 5 to 10 percent across realistic ranges.
The four lifecycle phases
A 30-year CBTC lifecycle decomposes into four phases.
Phase 1: Years 0 to 5 — Design, procurement, installation, testing, cutover. This phase concentrates 35 to 50 percent of undiscounted lifecycle cost in the form of initial CAPEX, plus elevated OPEX during dual-system parallel operations and Shadow Running. For a 25-mile US brownfield CBTC project at $15M to $30M per route-mile, Phase 1 CAPEX runs $375M to $750M. Add the soft costs (program management at 3 to 6 percent of CAPEX, ISA at 0.5 to 1.5 percent, BABA premium at 5 to 15 percent on equipment, Davis-Bacon at 30 to 50 percent on labor) and the Phase 1 cash-flow stream is a steep front-loaded curve.
Phase 2: Years 5 to 15 — Stable operations and first midlife upgrades. OPEX runs 2 to 4 percent of original CAPEX annually during this phase. Software support contracts run 8 to 15 percent of original software CAPEX annually, declining over the years as the system matures. The first major midlife event is a wayside radio refresh at year 8 to 10, costing 8 to 15 percent of original wayside radio CAPEX as the underlying 802.11 generation evolves. Software platform major-version releases occur every 4 to 6 years at 1 to 3 percent of original software CAPEX per version.
Phase 3: Years 15 to 25 — First major technology refresh. This phase delivers the largest capital expenses after the initial deployment. VOBC replacement runs 15 to 20 percent of original CAPEX. Zone Controller and RBC refresh runs 10 to 15 percent. OCC re-platforming runs 8 to 12 percent. Software re-architecture, where required to support new operating-system or cybersecurity baselines, can run 5 to 20 percent of original software CAPEX. Procurement and certification of replacement VOBCs requires 18 to 24 months because of the type-approval requirements; the refresh procurement should be planned at least 30 months ahead of the planned replacement window.
Phase 4: Years 25 to 30 — End-of-life planning. Capital intensity drops, but planning costs rise as the agency designs the replacement system, runs pilot deployments, and budgets for decommissioning. Replacement system design typically runs 2 to 5 percent of original CAPEX, pilot deployment 3 to 8 percent, decommissioning planning 0.5 to 1 percent.
A worked example: 25-mile brownfield heavy rail
The numbers below follow Chapter 14’s worked example. Analysis horizon: 30 years. Baseline discount rate: 2.0 percent real per OMB A-94. Inflation: 2.5 percent for electronics, 3.0 percent for labor.
Phase 1 (Years 0 to 5): Initial CAPEX $185M. This includes onboard ($25M to $35M for a 100-car fleet at $250K to $450K per cab), wayside ($55M to $70M at $2 to $3M per route-mile for a brownfield retrofit), communication ($25M to $35M including fiber backbone), central operations ($18M to $22M), engineering and program management ($35M to $50M), and testing/commissioning ($15M to $20M). Discounted to present value at 2.0 percent real, Phase 1 CAPEX is approximately $169M of the project’s $398M discounted lifecycle cost.
Phase 2 (Years 5 to 15): Annual OPEX accumulating to roughly $130M nominal. This includes signal maintenance labor (10 to 15 FTE in years 5 to 10 at major-metro fully-loaded labor rates of $150K to $200K per FTE annually), software support (declining from $4M to $2M annually), cybersecurity monitoring ($500K to $1.5M annually), and parts/spares ($400K to $800K annually). A year-7 software midlife upgrade adds roughly $8M nominal.
Phase 3 (Years 15 to 25): Major refresh costs $52M nominal at year 15 (VOBC and RBC) plus $28M nominal at year 22 (OCC re-platform). These are large discrete capital events that the financial plan must accommodate.
Phase 4 (Years 25 to 30): End-of-life planning $5M nominal. Decommissioning, replacement-system design, and pilot deployment.
Discounted total at 2.0 percent real: approximately $398M present value on a $530M nominal lifecycle cost. CAPEX represents 42.5 percent of discounted cost (35.0 percent of nominal). Annual OPEX represents 34.0 percent. Refresh cycles (year 15 and year 22) represent 11.3 percent. The remainder is midlife upgrades and decommissioning.
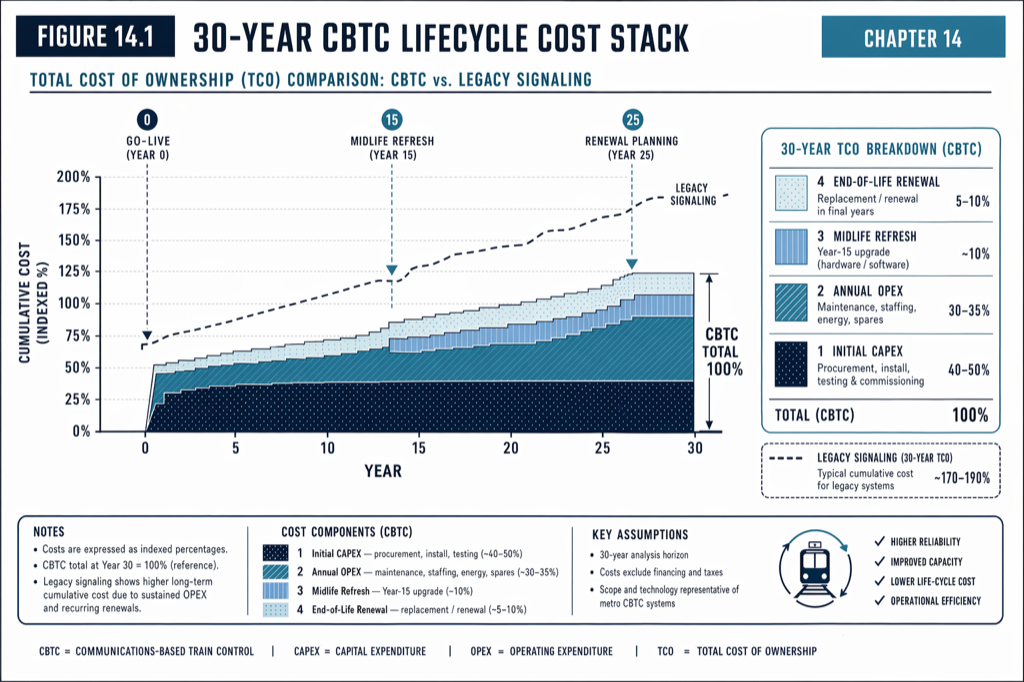 CAPEX dominates discounted lifecycle cost (42.5%) more than it dominates nominal cost (35.0%) because of front-loaded spending.
Sensitivity analysis: what moves the answer
A defensible LCCA presents sensitivity to the assumptions most likely to vary. Six sensitivities matter most.
Discount rate (±1.5 percentage points): moving from 2.0 percent real to 0.5 percent real increases discounted lifecycle cost by approximately 5 to 8 percent (in the worked example, from $398M to roughly $420M). Moving to 3.5 percent real decreases it by approximately 5 to 7 percent. Discount rate is the single largest controllable variable in the model.
Refresh timing (±2 to 3 years): accelerating the year-15 VOBC refresh to year 12, or extending to year 18, varies discounted cost by 3 to 4 percent. The probability of accelerated refresh depends on the supplier’s processor end-of-life decisions and the agency’s negotiated long-term support agreement.
Software support escalation (CPI + 1.5 percent vs. CPI + 3 percent): over 30 years, the differential creates 4 to 6 percent variance in cumulative OPEX. Multi-year fixed-rate contracts and EOL commitments are the most effective tools for bounding this risk.
Energy cost assumptions (±2 percent annually): accelerated energy-price growth (CPI + 2 percent) increases 30-year OPEX by 3 to 5 percent; declining energy costs reduce it by 2 to 3 percent. Energy is a smaller line item but a more volatile one.
BABA premium on refreshes (10 to 30 percent adder): for a year-15 VOBC refresh of $52M nominal, a 20 percent BABA premium adds $10.4M nominal ($6.4M discounted), increasing total discounted lifecycle cost by approximately 1.6 percent.
Contingency reserve realization (50 to 100 percent of allocated): a fully-realized contingency reserve adds approximately 6 percent variance to total discounted lifecycle cost relative to a 50-percent realization scenario.
A useful tornado diagram visualizing these sensitivities reveals that discount rate, refresh timing, and contingency realization each drive $20M to $45M variance — substantially outweighing energy cost uncertainty. The procurement strategies that most reduce the headline lifecycle cost are long-term fixed-escalation support contracts and disciplined contingency management.
Common modeling pitfalls
Five errors recur across CBTC LCCA submissions and trigger FTA Project Management Oversight Contractor revision requests.
Omitting cybersecurity operating costs. Dedicated cybersecurity staff ($400K to $1M annually), third-party assessments ($50K to $200K every 2 to 3 years), and TSA Security Directive 1580 compliance can reach 2 to 5 percent of annual OPEX by year 10. Models that use legacy-signaling cybersecurity baselines understate this category.
Flat OEM support pricing. Real-world OEM support contracts escalate annually at CPI + 1.5 to 3 percent. Models that assume constant nominal pricing for software support across 25 years understate cumulative OPEX by 15 to 25 percent.
Omitting parallel-operations costs during cutover. US brownfield transitions require 2 to 4 years of dual legacy/CBTC operation, increasing OPEX by 10 to 20 percent during the transition. Models that treat cutover as a one-time event miss this multi-year overhead.
Under-allocated OCC facility costs. Shared facility expenses (real estate, utilities, IT support, security) are frequently under-allocated to the CBTC project, understating OPEX by 15 to 30 percent.
Davis-Bacon wage escalation on refresh labor. Differential prevailing-wage escalation over 20 years adds $2.5M to $3M nominal that uniform inflation assumptions miss.
How the model supports the BCA
A defensible Benefit-Cost Analysis sits on top of the LCCA. Per USDOT 2024 BCA guidance, the standard discount rate for BCA is 3 percent real (separate from OMB A-94 at 2.0 percent real, used for federal capital project analysis). Benefits are monetized using passenger value of time (USD 17 to 20 per hour, 2024 dollars), avoided alternative capital expansion (an avoided new tunnel can be valued at USD 2 to 4 billion per mile in dense US metros), reliability improvements, and energy savings. A CBTC project with a Benefit-Cost Ratio (BCR) of 1.5 or higher is cost-effective; BCR above 2.0 is competitive for federal discretionary funding. Capacity benefits are typically the largest single category, often 40 to 70 percent of total discounted benefits.
Critically, BCR depends on a defensible LCCA on the cost side and a defensible benefits monetization on the revenue side. Either side weakened — by un-modeled OPEX growth, by overstated capacity gains, by un-supported induced-demand assumptions — undermines the entire ratio.
Sensitivity tornado diagram for a 25-mile US brownfield CBTC LCCA. Discount rate selection and contingency realization dominate.
Practical takeaways
- Use OMB Circular A-94 discount rates (2.0 percent real for 10 to 30 year horizon) for FTA Capital Investment Grant LCCA. Use USDOT 2024 BCA guidance discount rates (3 percent real) for BCR.
- Decompose the lifecycle into four phases: initial deployment (years 0 to 5), stable operations and midlife upgrades (years 5 to 15), major refresh (years 15 to 25), end-of-life planning (years 25 to 30).
- Budget initial CAPEX at $15M to $30M per route-mile for US brownfield, with the lower bound for greenfield and the upper for dense urban brownfield with extensive legacy integration.
- Include all six recurring sensitivities (discount rate, refresh timing, software support escalation, energy cost, BABA premium, contingency realization) with quantified bands.
- Avoid the five recurring modeling errors: omitted cybersecurity OPEX, flat OEM pricing, missing parallel-operations costs, under-allocated OCC facilities, missing Davis-Bacon escalation on refresh labor.
- Structure refresh procurement 30 months ahead of the planned replacement window. VOBC type approval requires 18 to 24 months even with prior certification.
Where to go next
This piece is the worked example. The full Total Cost of Ownership treatment, with multiple worked examples and the full BCR derivation, lives in Chapter 14 of Communications-Based Train Control, Volume 2 (Buy on Amazon). Download Chapter 14 slides (free PDF).
For the procurement-side cost drivers, see CBTC Procurement: Cost Drivers Beyond the Sticker Price. For the recurring overrun pattern that drives Phase 1 cost, see Why CBTC Projects Run 30%+ Over Budget — and How to Prevent It.
Sources
- Wang, C. (2026). Communications-Based Train Control, Volume 2: Operations, Deployment & Economics. Independent. ISBN 979-8-258-54295-3. — Chapter 14, “Lifecycle Costs and Economic Justification.”
- Office of Management and Budget. OMB Circular A-94: Guidelines and Discount Rates for Benefit-Cost Analysis of Federal Programs. whitehouse.gov/omb
- US Department of Transportation. Benefit-Cost Analysis Guidance for Discretionary Grant Programs (2024). transportation.gov/policy/transportation-policy/benefit-cost-analysis-guidance
- Federal Transit Administration. Capital Investment Grants Program. transit.dot.gov/CIG
- Federal Transit Administration. (2016). FTA Report No. 0045: Communications-Based Train Control (CBTC) Technology. transit.dot.gov
- Bay Area Rapid Transit. Train Control Modernization Program. bart.gov/about/projects/cbtc
- Transportation Security Administration. Security Directive 1580-23-01: Rail Cybersecurity. tsa.gov
Read the full treatment in the book
Chapter 14 of Communications-Based Train Control, Volume 2, covers this in depth.