procurement · Article
CBTC ROI Calculation: Headway Gains vs Capital Outlay

When the New York Metropolitan Transportation Authority (MTA) presented the Queens Boulevard Communications-Based Train Control (CBTC) project to its board in the mid-2010s, the headline that carried the room was not the technology choice or the contractor shortlist. It was a single number: a Benefit-Cost Ratio (BCR) above 2.0, driven almost entirely by the line’s ability to defer a multi-billion-dollar parallel tunnel for two decades. That ratio is the language federal funders, rating agencies, and elected officials all read. Computing it correctly is the single most consequential analytical task of a CBTC business case. Get it wrong on the optimistic side and the Project Management Oversight Contractor (PMOC) cuts the capacity benefit in half before scoring; get it wrong on the conservative side and the project loses out to a less ambitious competitor in the same Capital Investment Grant cycle.
Why ROI is the gatekeeper, not a formality
Federal Transit Administration (FTA) discretionary grants exceeding $25 million require formal Benefit-Cost Analysis (BCA) per United States Department of Transportation (USDOT) 2024 Benefit-Cost Analysis Guidance. Boards demand the same arithmetic, even when no federal money is on the table, because a signaling resignaling project commits 30 years of capital. CBTC ROI calculation is, in practice, four operations: monetize the capacity gain that headway compression delivers; subtract the present-valued capital outlay; layer in safety, operating, and ridership benefits; then stress-test the result. A project with BCR ≥ 1.5 is cost-effective by USDOT standards; BCR > 2.0 is competitive for FTA Core Capacity funding. The arithmetic looks simple. Each input is contested. This post is the procurement-desk walkthrough for the program manager, deputy general manager for capital, and FTA grants officer who must defend the BCR in front of skeptical reviewers. The full lifecycle treatment lives in Chapter 14 of Communications-Based Train Control, Volume 2.
The capital outlay side: pin it down before claiming benefits
Before any benefit can be discounted to present value, the agency needs a defensible cost stack. Manuscript Chapter 14.1 puts US brownfield CBTC capital costs in the range of roughly $15 to $30 million per route-mile, with significant variation by fleet size, civil-work scope, parallel-operations strategy, and the Buy America premium. A fully scoped 25-mile heavy-rail brownfield project therefore lands somewhere between $375 million and $750 million in capital, before contingency. Add 20 to 30 percent contingency for risk, and the headline number a board sees is closer to $500 million to $1 billion.
Capital is not the whole cost. A 30-year Total Cost of Ownership (TCO) model includes ongoing operating expenditure, the technology refresh at year 10 to 12 (typically 30 to 50 percent of original Vehicle On-Board Controller cost), and a midlife wayside refresh sometimes treated as a smaller capital event in years 15 to 20. (For the full TCO walkthrough, see CBTC Lifecycle Cost: A 30-Year Model Walk-Through.) Discounted at 2.0 percent real per Office of Management and Budget Circular A-94 for the 10-to-30-year horizon, those out-year costs are real but compressed; the front-loaded capital dominates the cost-side present value.
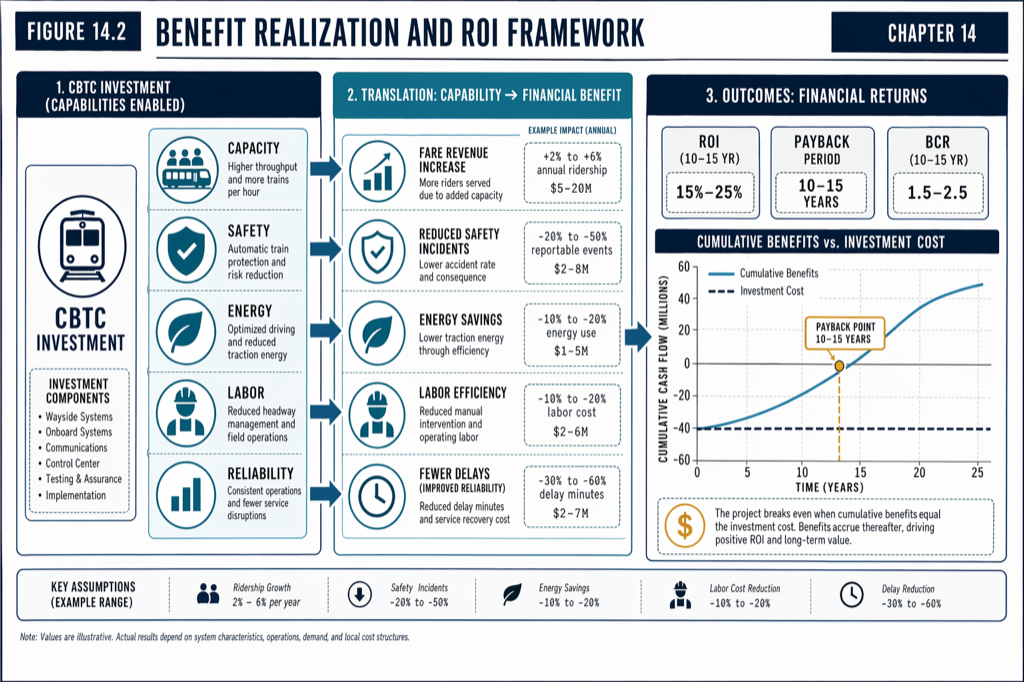 The CBTC business case is a 30-year cash-flow comparison: discounted capital and operating costs on the left, discounted benefit categories on the right.
Monetizing headway gains: three valid methods, one allowed
The capacity benefit is the largest line in nearly every brownfield CBTC BCA — typically 40 to 70 percent of total discounted benefits — and the line PMOC reviewers cut hardest. The fundamental mechanic is the same in every method: shorter headways enable more trains per hour per direction, which enables more passengers, which the analyst converts to dollars. The three monetization paths the manuscript identifies are the avoided capital cost of an alternative expansion, additional passenger throughput times Value of Travel Time, and induced-demand economic development value. Best practice picks one as primary and notes the others in sensitivity analysis. Stacking all three in full is the most common form of double-counting, and is what PMOC reviewers look for first.
The avoided-capital-cost path is the strongest for capacity-constrained urban heavy rail. If a corridor is forecast to exceed capacity within 15 years and would otherwise require a parallel tunnel costing $2 billion to $4 billion per mile, deferring that tunnel by 20 years through CBTC capacity uplift has a present-value benefit measured in billions. A $5 billion tunnel deferred 20 years has a Net Present Value (NPV) benefit of roughly $2 billion to $3 billion at a 3 percent USDOT BCA discount rate.
The throughput-times-VoT path quantifies passenger time savings directly. USDOT 2024 guidance values transit travel time at $17 to $20 per hour (2024 dollars). A 25 percent frequency improvement reduces wait time by roughly one minute per trip, and headway-elasticity work puts the induced-demand response at 0.4 to 0.6 — meaning a 25 percent frequency increase induces 10 to 15 percent more trips. The arithmetic is self-contained and easy to defend, but the dollar totals are smaller than the deferred-capital approach when a credible alternative project exists.
A worked headway-gain calculation
Take a hypothetical 10-mile urban heavy-rail line currently running 22 trains per hour (tph) at a 2-minute-44-second peak headway, 85 percent load factor, 4,400 peak-hour passengers, 65 million annual riders. CBTC tightens that to 28 tph at a 2-minute headway — a 25 percent capacity uplift consistent with the manuscript Chapter 14.5 worked example.
Apply a 0.5 induced-demand elasticity: a 25 percent frequency increase induces roughly 12.5 percent additional annual trips, or 8.1 million new annual passenger trips. Value those new trips at the wait-time savings each one represents — about one minute per trip — at $18 per hour of travel time. The annual capacity benefit is 8.1 million trips times $0.30 per trip equals roughly $2.4 million per year. A 30-year stream discounted at 3 percent has a present-value factor of about 19.6, giving an NPV of about $48 million.
That is a small benefit because it does not include crowding relief, the value of the entirely new trips themselves, or any deferred infrastructure. The same 25 percent capacity uplift, valued through a credible alternative tunnel deferral, can produce $2 billion to $3 billion in present value on a comparable corridor. The difference between $48 million and $2 billion is the difference between a project that needs every other benefit category to clear BCR 1.5 and a project that clears BCR 3.0 on capacity alone.
Layering safety, O&M, ridership, and environmental benefits
Capacity is the headline, but the other categories typically add 30 to 60 percent of total benefits in a well-built BCA. Safety benefits, monetized via the USDOT Value of Statistical Life ($13.2 million in 2024 dollars) and the standard injury-cost schedule, typically run 5 to 15 percent of total benefits. Reduction factors are conservative and well-established: 60 to 90 percent of overspeed and rear-end collisions are addressable by Automatic Train Protection, 40 to 70 percent of platform-edge incidents, 20 to 40 percent of work-zone events.
Operating and maintenance savings of 10 to 20 percent at steady state (year 5 to 7 post-cutover) typically yield $15 million to $35 million NPV per 10 miles of CBTC heavy rail, after accounting for the parallel-operations cost ramp-up in years 1 to 3. Ridership-revenue uplift on induced trips, valued at the marginal cost-to-revenue gap of $1 to $3 per trip, adds another 5 to 15 percent. Environmental benefits — Social Cost of Carbon, criteria pollutants, congestion relief — add 2 to 5 percent and are increasingly weighted in equity and climate scoring.
Stacked, a representative brownfield heavy-rail BCA produces a benefit profile in the rough proportions of 55 percent capacity (deferred-capital basis), 13 percent O&M savings, 10 percent safety, 9 percent ridership uplift, 3 percent environmental, and 10 percent residual benefits. Total benefits in the $4 billion to $5 billion range against $1.5 billion to $2 billion in costs produce BCRs in the 2.0 to 2.5 range, which is the competitive zone for federal Core Capacity funding.
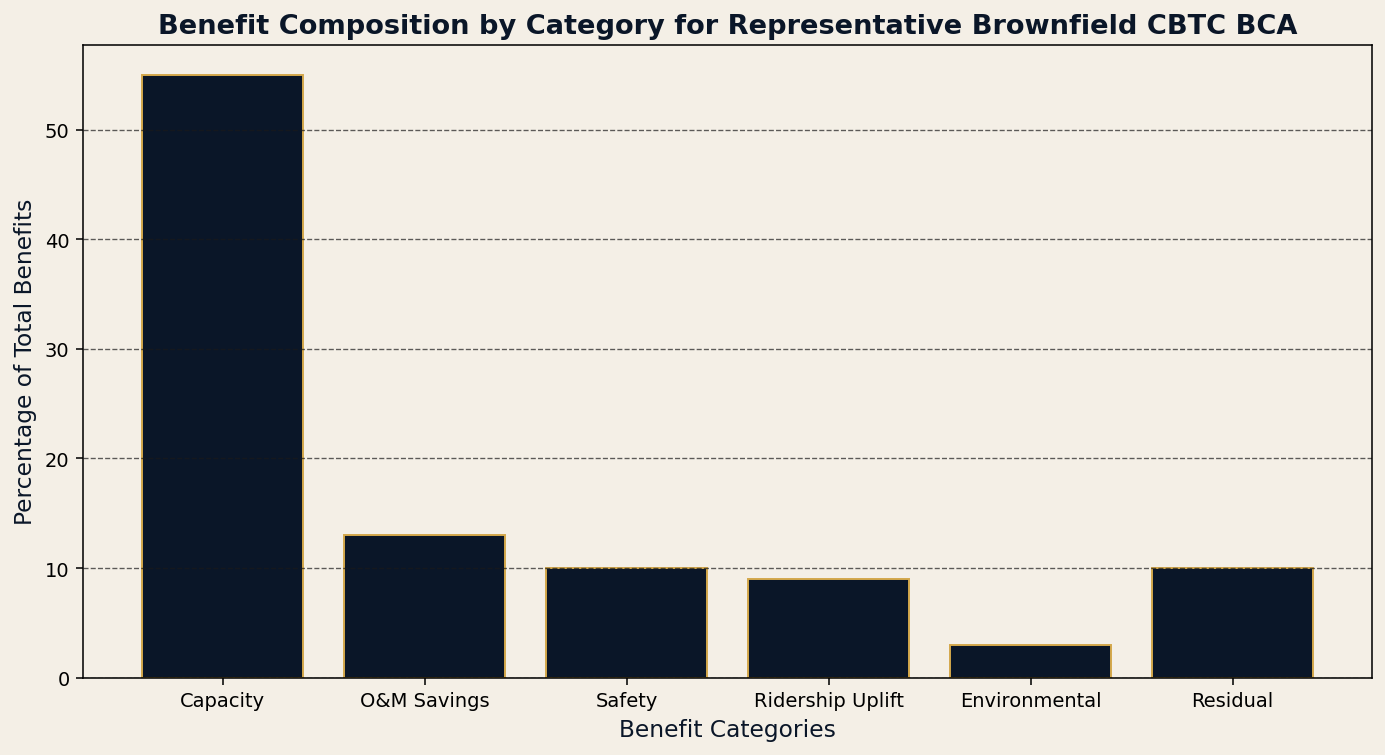 Capacity dominates the brownfield BCR; safety, O&M savings, and ridership add the credibility margin that survives PMOC.
Stress-testing: the BCR your skeptic will compute
The BCR a board approves is rarely the BCR the project delivers. Best-practice BCAs document Low, Base, and High scenarios with explicit assumptions: capacity benefit at 60, 80, and 95 percent of theoretical claim; O&M savings realized over 5, 3, and 2 years; capital cost escalation at 0, 10, and 20 percent. The Low scenario typically reduces BCR by 25 to 40 percent against the Base. Projects that pass Low with BCR ≥ 1.5 are robust; projects that pass only the Base are exposed.
Two specific sensitivities deserve attention. First, the discount rate: USDOT BCA Guidance currently uses 3 percent real, but a 2 percent real OMB rate applies to other federal financial analyses. A swing from 3 to 7 percent (the older OMB long-rate guidance) compresses out-year benefits sharply and can push a borderline project below 1.5. Second, the realized capacity uplift: PMOC reviewers commonly reduce claimed gains from the theoretical 40 percent to an operationally validated 15 to 25 percent if the analyst has not modeled terminal turnback constraints, dwell-time bottlenecks, rolling-stock availability, and maintenance window conflicts.
A defensible BCR documentation pack includes: explicit headway and ridership assumptions with cited data sources; rolling-stock and terminal capacity audits validating the assumed throughput; independent engineering review of brake performance and position uncertainty parameters that drive the headway claim; and a downside-case BCR at the 10th percentile of a Monte Carlo distribution where capacity uplift, O&M savings, and capital cost escalation all draw from documented probability ranges.
The L Line as a sanity check
The MTA L Line CBTC project, the most-cited US case study, reported an independent-analysis BCR of roughly 1.9 to 2.1 depending on discount-rate assumptions, against an approximately $2.5 billion capital cost. The benefits were dominated by capacity uplift on a heavily loaded, aging corridor and by O&M savings against an end-of-life legacy signaling system. A BCR in that range is defensible without leaning on speculative deferred-tunnel benefits, which the L Line did not have a credible alternative to claim. (For broader context on the L Line economics, see What Is Communications-Based Train Control (CBTC)? A 2026 Plain-English Guide.)
The lesson the L Line teaches the next agency: a 2.0 BCR is achievable on a high-density corridor with aging signaling without inventing benefits. Below that BCR, the project either needs a deferred-infrastructure alternative to claim, or it needs to look hard at whether CBTC is the right intervention at all. (For the contrarian operating profiles where it is not, see When CBTC Is a Bad Investment: 5 Operating Profiles That Don’t Fit.)
Practical takeaways
- Pick one capacity-monetization method as primary (deferred-infrastructure cost is strongest for high-density urban corridors; throughput times Value of Travel Time is strongest where no credible alternative project exists). Do not stack all three in full.
- Validate claimed headway gains against terminal turnback, dwell time, rolling-stock availability, and maintenance-window constraints before letting the BCA into a draft. PMOC reviewers will validate them either way.
- Build the cost stack on a 30-year TCO basis at the OMB Circular A-94 rate; build the benefit stack at the USDOT BCA Guidance 3 percent real. Document the rate clearly, and stress-test against alternative rates.
- Include Low, Base, High scenarios with explicit assumption variations. A project that clears BCR 1.5 in the Low case is the project that survives a hostile board meeting.
- Treat the BCR as a communications artifact as much as a calculation. Document assumptions, cite data sources, present confidence intervals, and disclose break-even thresholds. The analyst’s credibility outlasts any single number.
Where to go next
This post is a 10-minute summary. The full benefit-cost framework, including the 30-year worked TCO and the safety, O&M, deferred-capital, ridership, and environmental monetization details, lives in Chapter 14 (Lifecycle Costs) of Communications-Based Train Control, Volume 2: Operations, Deployment & Economics (Buy on Amazon). Download Chapter 14 slides (free PDF) for the BCR worked example and sensitivity tables.
For the complementary funding-stack mechanics that determine which benefits attract which federal dollars, see Funding a CBTC Project: FTA, Federal, State, and Local Sources.
Sources
- Wang, C. (2026). Communications-Based Train Control, Volume 2: Operations, Deployment & Economics. Independent. ISBN 979-8-258-54295-3. — Chapter 14, “Lifecycle Costs,” sections 14.1, 14.3, and 14.5.
- United States Department of Transportation. (2024). Benefit-Cost Analysis Guidance for Discretionary Grant Programs. transportation.gov/policy/transportation-policy/benefit-cost-analysis-guidance
- Office of Management and Budget. Circular A-94: Guidelines and Discount Rates for Benefit-Cost Analysis of Federal Programs. whitehouse.gov/omb/circulars
- Federal Transit Administration. Capital Investment Grants Program. transit.dot.gov/CIG
- Federal Transit Administration. (2016). FTA Report No. 0045: Communications-Based Train Control (CBTC) Technology. transit.dot.gov
- MTA New York City Transit. Communications-Based Train Control Status Update. new.mta.info/project/communications-based-train-control-cbtc
- Bay Area Rapid Transit. Train Control Modernization Program. bart.gov/about/projects/cbtc
How this article was produced. Drafted with AI assistance, then reviewed and fact-checked by Chunjun (Francisco) Wang against Communications-Based Train Control (the author's two-volume reference) and primary sources — agency records, vendor documentation, and IEEE/IEC standards. Every date, vendor, and figure is traceable to a cited source. Spot a mistake? Corrections are welcome via the contact page.
Read the full treatment in the book
Chapter 12 of Communications-Based Train Control, Volume 2, covers this in depth.