operations · Article
Headway Optimization: Beyond the Theoretical Minimum

When a US transit agency commissions a CBTC business case, the headline number is almost always the theoretical minimum headway. The vendor’s proposal cites 90 seconds. The agency’s projection cites 30 trains per hour. The board approves a multi-year capital program on those numbers. Three years after revenue service, the line is running 26 trains per hour and the dispatcher still has not seen a 90-second cycle hold for an entire peak hour. The gap between the theoretical minimum and the achievable headway is not a defect; it is the structural consequence of how a real metro line operates. Understanding where the gap comes from — and which pieces of it the agency can actually close — is what turns a capacity number on a slide into trains per hour in revenue service.
The theoretical minimum is a ceiling, not a target
Theoretical minimum headway is the smallest headway physically possible given the train characteristics, the signaling system, and the line geometry. The manuscript’s Chapter 13 treatment decomposes it into five additive components: braking distance from operating speed (about 20 to 30 seconds), safety margin for positioning uncertainty (3 to 6 seconds), Movement Authority controller delay (2 to 4 seconds), train length transit time (8 to 12 seconds), and station dwell time (25 to 40 seconds typical, 45 to 60-plus seconds at major interchanges during peak). The sum is the theoretical minimum, and it is the number that justifies the procurement.
The capacity formula is simple. Trains per hour equals 3,600 divided by headway in seconds. A 90-second headway yields 40 tph; 120 seconds yields 30 tph; 180 seconds yields 20 tph. Every second of headway saved across the full minimum is one additional fractional train per hour, and on a line running near capacity, fractional trains compound into meaningful annual ridership.
Achievable headway is what the line actually delivers in revenue service. It is consistently 20 to 40 percent higher (less frequent) than the theoretical minimum on a well-designed CBTC line. The MTA L Line, designed for up to 30 tph, runs 24 to 29 tph in revenue service — a 67 to 81 percent realization of theoretical minimum. BART’s Train Control Modernization Program targets 30 tph against a theoretical minimum closer to 40, a 75 percent realization. These are strong results. Achieving 80 percent of theoretical minimum on a US heavy-rail line is considered excellent. (For the underlying mechanics that govern how Movement Authority interacts with each component of the theoretical minimum, see The Movement Authority Concept: How a CBTC Train Decides How Far to Go.)
The gap between theoretical and achievable is not a deficiency of CBTC. It is the structural cost of operating a real line.
Where the gap actually comes from
Five sources of variability separate theoretical from achievable, and each behaves differently under operational pressure.
The first is robustness margin. System designers add buffer beyond the calculated safety minimum to handle aging equipment, sensor drift, edge-case track conditions, and the cumulative uncertainty that comes from decades of operating life ahead. A 5 to 10 percent margin on the braking-distance component alone consumes 1 to 3 seconds of headway. This margin is not negotiable; it is the engineering reserve that keeps the system safe over its full lifecycle.
The second is controller response variability. A real Zone Controller does not respond in exactly two seconds every cycle. The actual cycle time varies with system load, message queue depth, and network jitter; the variability is small (±0.5 seconds is typical) but it has to be covered by additional headway allowance because the controlling case for safety is the worst credible cycle, not the average.
The third is traffic variability. When one train brakes harder than expected — a passenger emergency button activation, an unscheduled stop for a track obstruction — the following train must brake harder to maintain separation, and the headway between them spikes. The system has to be designed against the worst credible spike, not the median. A 10-second spike that occurs once per hour averages to less than 0.3 seconds across the hour but consumes 10 seconds of margin in the procurement.
The fourth is dwell variance. Theoretical minimum assumes a constant dwell time at every station. Actual dwell varies with passenger loading, peak direction, time of day, and station-specific characteristics: a station with curved platforms and wide door-to-platform gaps takes longer than a station with straight platforms and level boarding; a major interchange takes longer than an intermediate stop. Variance of ±10 seconds station-to-station is normal even on a well-disciplined line, and the trailing train absorbs the variance as a longer headway whenever the leader dwells longer than nominal.
The fifth is staff and passenger behavior. On a GoA 2 line, the operator’s acceleration and braking discipline introduces variance that ATO does not — the operator approves door close, the operator drives the platform departure, and platform-departure timing varies with the operator. Passenger behavior introduces similar variance: a crowded morning takes longer to load than a thin midday; a weather event slows boarding, and the cumulative effect across a peak period erodes a meaningful fraction of theoretical minimum.
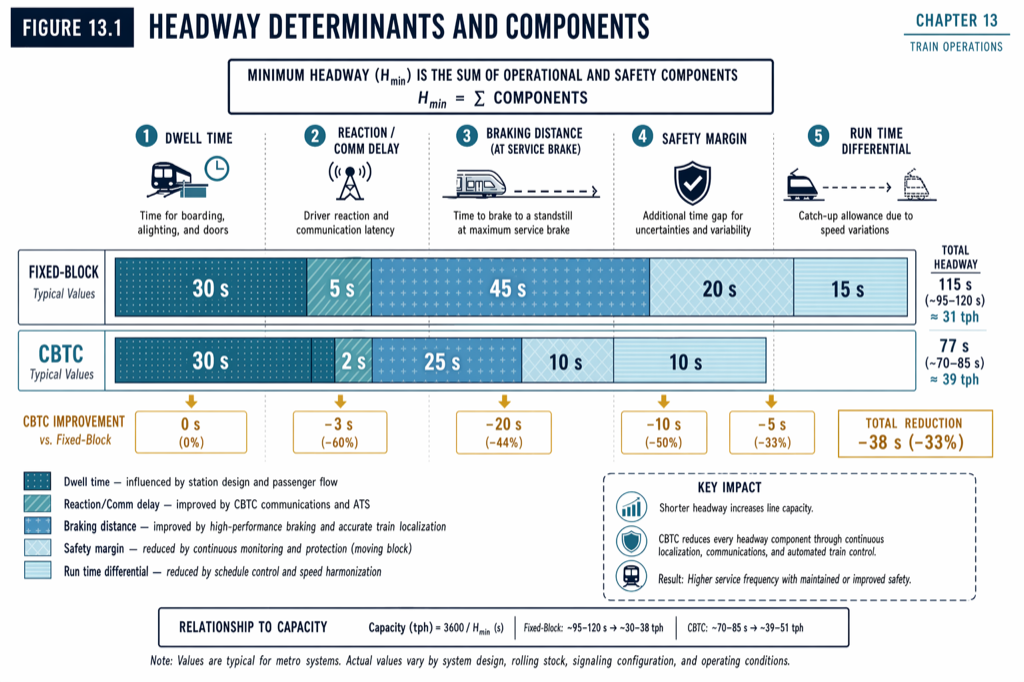 Theoretical minimum headway is the sum of five additive components. Achievable headway adds five sources of variability on top.
Dwell is the silent capacity killer
The single largest variable component of headway is dwell time, and it is also the component CBTC has the least direct influence over. CBTC reduces braking-distance variability and controller delay; it does not change the physics of how fast passengers can board and alight.
Typical US urban metro dwell ranges from 20 seconds at lightly loaded suburban stations to 45 to 60-plus seconds at major interchanges during peak hours. The L Line averages 27 seconds. WMATA’s Red Line at Gallery Place can exceed 50 seconds at peak. Dwell is governed by passenger loading (the dominant term), door width and count, platform curvature, ridership mix, and platform-to-floor level boarding.
Reducing dwell requires structural interventions, not signaling improvements. The manuscript identifies four levers. Platform screen doors save 5 to 8 seconds per stop by allowing earlier door opening and reducing draft-related door-cycle delays. Level boarding (platform-to-floor gap eliminated) saves 5 to 8 seconds by removing wheelchair boarding delay and reducing elderly passenger boarding time. Wider doors and more doors per car save 10-plus seconds on crowded lines by parallelizing the boarding flow. Improved boarding discipline (clear-aisle markings, staff-managed boarding flow at major interchanges) saves 2 to 3 seconds on average.
The total impact of full dwell optimization is 15 to 30 seconds system-wide. On a heavily dwell-constrained line — a 50-second baseline dwell — a 20-second reduction translates to a 30 to 60 percent capacity uplift, which on a 150-second baseline headway is the difference between 24 tph and 30 tph. (For why door operation specifically is the dominant constraint at the highest service frequencies, see Why Door Operation Is the Bottleneck in High-Frequency Service.)
The procurement implication is that the highest-leverage capacity decisions on a CBTC retrofit are often not in the CBTC scope. They are platform-modification decisions, rolling-stock decisions, and station-design decisions that have to be coordinated with the signaling project to actually realize the capacity the CBTC business case promised.
Terminal turnback and junctions: the constraints that gate the line
A line is rarely capacity-limited on open track. It is capacity-limited at the terminus, where the train stops, reverses, dwells, and re-enters the line; or at a flat junction, where two lines share a track segment and the interlocking has to resolve conflicts sequentially.
A single-track terminal — one terminal track shared by both directions — caps turnback headway at 4 to 6 minutes regardless of signaling, because the train must occupy the platform, board passengers, reverse, and clear before the next train can enter. A line capable of 90-second open-track headway falls to 180 to 200 seconds (18 to 20 tph) at a single-track terminal.
A double-track terminal allows simultaneous use of two parallel platforms; while one train boards on platform A, the other reverses and departs from platform B. Turnback headway drops to 2.5 to 3 minutes (150 to 180 seconds). Adding a pocket track — a parallel siding that allows a train to reverse without occupying a mainline platform — can drop terminal headway closer to 120 to 150 seconds at high capacity.
The L Line illustrates the terminal-bypass case. Because the L Line’s southern segment runs single-direction on a branch and does not reverse at a central terminal, the line avoids the turnback bottleneck and achieves 24 to 29 tph against a theoretical minimum of about 36 tph. Most other US retrofit lines have to absorb the turnback constraint, and the achievable headway is gated by the terminal design.
A flat junction — at-grade intersection where two lines share a track segment — adds a similar 2- to 3-minute per-train constraint because only one train can transit the junction at any instant. CBTC offers no direct fix; the constraint is interlocking logic, not signaling. Flying junctions (grade-separated, no conflicts) eliminate the constraint but cost $50 to $100 million per junction in urban US construction. The pragmatic alternative is service-pattern optimization — holding back trains from one line during the other’s peak — which sacrifices theoretical capacity for operational stability.
What an agency can actually do to close the gap
Closing the theoretical-to-achievable gap is a portfolio of investments, not a single decision.
The first is dwell optimization. Platform screen doors, level boarding, wider doors, and operational discipline together can reduce dwell by 15 to 30 seconds system-wide. On a dwell-constrained line, this is the highest-leverage capacity intervention available, and it is largely outside the CBTC procurement scope.
The second is terminal modernization. Adding a pocket track, converting a single-track terminal to double-track, or rebuilding a flat junction as a flying junction are expensive infrastructure investments, but they directly relieve the constraints that gate the line. Where the demand justifies it, these are typically the next infrastructure investments after a CBTC retrofit.
The third is robustness-margin tuning over the life of the system. As operational data accumulates and the system’s variability is better characterized, the safety margins and timeouts in the Movement Authority calculation can sometimes be tightened — never below the safety case, but within the engineering reserve. This is a cumulative, multi-year program of post-revenue tuning, not a one-time fix.
The fourth is degraded-mode minimization. Every minute of Restricted Manual or Non-CBTC bypass operation reduces achievable capacity below theoretical. Reducing the frequency and duration of degraded operation — through maintenance investment, redundancy upgrades, and overlay-vs-standalone deployment topology — is one of the most direct ways to close the gap. (For the structured response to degraded operation, see Operating Modes in CBTC: Normal, Restricted, Manual, Failure.)
The fifth is operator and passenger behavior. On GoA 2 lines, operator training and ATO trust-building over the first 18 to 36 months of revenue service measurably reduce the operator-introduced variance. On every line, passenger behavior changes with platform announcements, platform staff, and signage that direct boarding flow.
What this means in practice
- Theoretical minimum headway is a ceiling, not a target. Achievable headway in revenue service is consistently 20 to 40 percent above theoretical, and 80 percent realization is excellent.
- Five sources separate theoretical from achievable: robustness margin, controller variability, traffic variability, dwell variance, and behavioral variability. Each requires a different countermeasure.
- Dwell is the silent capacity killer. CBTC alone does not reduce dwell; PSDs, level boarding, wider doors, and boarding discipline together can deliver 15 to 30 seconds of system-wide reduction.
- Terminal turnback and flat junctions gate the line. A single-track terminal or a flat junction often constrains a line capable of 90-second open-track to 180- to 200-second achievable.
- Closing the theoretical-to-achievable gap is a portfolio: dwell optimization, terminal modernization, robustness-margin tuning, degraded-mode minimization, and behavioral interventions. Most of these investments live outside the CBTC procurement scope and have to be coordinated with it.
Where to go next
This post is an 11-minute summary. The full treatment lives in Chapter 13 of Communications-Based Train Control (Volume 2): Buy on Amazon · Download Chapter 13 slides (free PDF)
Sources
- Wang, C. (2026). Communications-Based Train Control, Volume 2: Operations, Lifecycle, and US Deployment. Independent. ISBN 979-8-258-54295-3. — Chapter 13, “Performance Criteria and Capacity Analysis.”
- Transit Cooperative Research Program. TCRP Report 163: Transit Capacity and Quality of Service Manual. Transportation Research Board.
- IEEE Standards Association. IEEE Std 1474.1: Standard for Communications-Based Train Control (CBTC) Performance and Functional Requirements.
- MTA New York City Transit. L Line and 7 Line Capacity Reports. new.mta.info
- BART. Train Control Modernization Program — Capacity Analysis. bart.gov/about/projects/tcmp
- WMATA. Red Line Capacity Studies. wmata.com
- American Public Transportation Association. Standards for Communications-Based Train Control (CBTC) Systems.
How this article was produced. Drafted with AI assistance, then reviewed and fact-checked by Chunjun (Francisco) Wang against Communications-Based Train Control (the author's two-volume reference) and primary sources — agency records, vendor documentation, and IEEE/IEC standards. Every date, vendor, and figure is traceable to a cited source. Spot a mistake? Corrections are welcome via the contact page.
Read the full treatment in the book
Chapter 13 of Communications-Based Train Control, Volume 2, covers this in depth.